
Your n8n workflows process thousands of records daily, but execution times keep increasing. Memory usage spikes during peak hours. API costs are climbing despite optimization efforts. You've implemented the basics—batch processing, error handling, modular design—but performance bottlenecks persist.
This isn't a beginner's guide. If you're already using n8n effectively and need to push workflows to enterprise scale, you need advanced optimization techniques that go beyond tips and tricks.
Key Insight: Advanced optimization isn't about individual tips—it's about systematic performance analysis, architectural patterns, and continuous monitoring. Teams that implement these techniques see 60-80% reductions in execution time and 70-90% cost savings on API-heavy workflows.
The workflow automation market is projected to reach $26 billion by 2025, with businesses processing increasingly complex automations at scale (Source: Quixy 2025 Workflow Statistics). As workflows grow in complexity, performance optimization becomes critical for maintaining reliability and controlling costs.
This guide covers advanced n8n optimization techniques for 2025: workflow profiling and performance analysis, memory optimization strategies, parallel execution patterns, and comprehensive monitoring solutions. These techniques are designed for teams already running production workflows who need to scale efficiently.
Workflow Profiling and Performance Analysis
Before optimizing, you need to identify where workflows spend time and resources. Profiling reveals bottlenecks that aren't obvious from casual observation.
Identifying Performance Bottlenecks
Performance bottlenecks in n8n workflows typically fall into four categories:
1. Node Execution Time Individual nodes that take longer than expected. Common culprits:
- API calls without proper rate limiting
- Database queries without indexes
- Complex Code node operations
- Large data transformations
2. Sequential Processing Workflows that process data sequentially when parallel execution is possible. Example: Enriching 1,000 leads one-by-one instead of in parallel batches.
3. Memory Consumption Workflows that load entire datasets into memory instead of streaming or batching. This causes slowdowns and potential crashes with large datasets.
4. External Dependencies Slow external APIs, database connections, or network latency that create cascading delays.
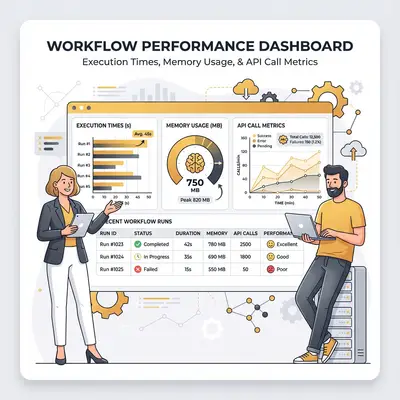
Performance Metrics to Track
Establish baseline metrics before optimization:
Execution Time Metrics:
- Total workflow execution time: End-to-end duration
- Per-node execution time: Time spent in each node
- API call latency: Time waiting for external API responses
- Database query time: Time spent on database operations
Resource Metrics:
- Memory usage per execution: Peak memory consumption
- CPU utilization: Processing intensity during execution
- Network I/O: Data transfer volumes
Cost Metrics:
- API calls per execution: Number of external API requests
- Token usage: AI API token consumption
- Database operations: Query count and complexity
Reliability Metrics:
- Success rate: Percentage of successful executions
- Error frequency: Types and frequency of failures
- Retry rate: How often workflows need retries
Tools for Profiling n8n Workflows
n8n provides built-in tools for performance analysis, and several third-party solutions extend monitoring capabilities.
Built-in n8n Monitoring:
1. Execution Logs Access detailed execution logs in n8n's UI:
- Navigate to Executions → Select a workflow execution
- View node-by-node execution times
- Identify nodes with longest execution duration
- Review error messages and stack traces
2. Workflow Statistics Use n8n's workflow statistics to track:
- Average execution time over time periods
- Success/failure rates
- Most frequently executed nodes
- Peak usage times
3. Performance Benchmarking n8n's benchmarking framework allows you to:
- Run controlled performance tests
- Compare workflow versions
- Measure improvements after optimization
- Identify regression in performance
Third-Party Monitoring Solutions:
1. Prometheus + Grafana For self-hosted n8n instances, integrate Prometheus metrics:
- Export n8n execution metrics
- Create custom dashboards in Grafana
- Set up alerts for performance degradation
- Track trends over time
2. Custom Monitoring Scripts Build custom monitoring using n8n's API:
- Query execution history programmatically
- Aggregate performance metrics
- Generate performance reports
- Alert on anomalies
3. Application Performance Monitoring (APM) Tools Integrate n8n with APM tools like:
- New Relic
- Datadog
- Sentry
These tools provide distributed tracing, error tracking, and performance monitoring across your entire automation infrastructure.
Interpreting Execution Logs and Performance Data
Execution logs reveal patterns that indicate optimization opportunities:
Pattern 1: Sequential Bottleneck
Node 1: 0.5s
Node 2: 0.5s
Node 3: 0.5s
Node 4: 0.5s
Total: 2.0s
If nodes 2-4 are independent, they could run in parallel, reducing total time to ~1.0s.
Pattern 2: API Latency Dominance
Webhook: 0.1s
API Call 1: 2.5s (waiting for response)
API Call 2: 2.3s (waiting for response)
API Call 3: 2.4s (waiting for response)
Total: 7.3s
API calls dominate execution time. Consider batching, parallel execution, or caching.
Pattern 3: Memory Spikes
Start: 50MB
After loading 10K records: 450MB
After processing: 480MB
Peak: 520MB
Memory usage spikes indicate need for streaming or batch processing.
Advanced Batch Processing Strategies
Basic batch processing splits data into chunks. Advanced strategies optimize batch size dynamically, handle errors gracefully, and minimize costs.
Dynamic Batch Sizing Based on API Limits
Static batch sizes waste resources. Dynamic sizing adapts to API limits, data complexity, and current system load.
Static vs Dynamic Batching:
Static approach:
Process 100 records per batch (fixed)
- Works for simple APIs
- Fails when API limits change
- Wastes time with small batches on fast APIs
Dynamic approach:
Calculate optimal batch size based on:
- API rate limit (e.g., 50 requests/minute)
- Average processing time per record
- Current system load
- Remaining quota

Example calculation:
Rate limit: 50 requests/minute = 1.2 seconds per request
Processing time: 0.3 seconds per record
Optimal batch: 4 records per request (1.2s / 0.3s)
Implementation Pattern:
Use a Code node to calculate batch size dynamically:
// Calculate optimal batch size
const apiRateLimit = 50; // requests per minute
const avgProcessingTime = 0.3; // seconds per record
const requestsPerSecond = apiRateLimit / 60;
const timePerRequest = 1 / requestsPerSecond;
const optimalBatchSize = Math.floor(timePerRequest / avgProcessingTime);

// Ensure batch size is within API limits
const maxBatchSize = 10; // API maximum
const minBatchSize = 1;

const batchSize = Math.max(
  minBatchSize,
  Math.min(optimalBatchSize, maxBatchSize)
);

return [{ json: { batchSize } }];
Batch Processing Patterns for Different Scenarios
Different scenarios require different batching strategies:
Pattern 1: Time-Based Batching Process records in time-based windows:
- Useful for real-time data streams
- Ensures fresh data processing
- Balances latency vs throughput
Pattern 2: Size-Based Batching Process records in fixed-size batches:
- Predictable memory usage
- Easier to debug
- Good for batch APIs
Pattern 3: Adaptive Batching Adjust batch size based on:
- API response times
- Error rates
- System load
- Remaining quota
Pattern 4: Priority-Based Batching Process high-priority records in smaller, faster batches:
- Critical data processed first
- Lower-priority data batched larger
- Balances urgency vs efficiency
Error Handling in Batch Operations
Batch processing amplifies error impact. One failed batch can affect hundreds of records.
Error Handling Strategies:
1. Continue on Error Process remaining batches even if one fails:
Batch 1: Success (100 records)
Batch 2: Error (100 records) → Log error, continue
Batch 3: Success (100 records)
Batch 4: Success (100 records)
Result: 300 records processed, 100 logged for retry
2. Partial Batch Recovery When a batch fails, retry individual records:
Batch fails with 10 records
- Retry each record individually
- Identify which records caused failure
- Process successful records
- Log failed records for manual review
3. Exponential Backoff for Batch Retries Retry failed batches with increasing delays:
First retry: Wait 5 seconds
Second retry: Wait 10 seconds
Third retry: Wait 20 seconds
Max retries: 3
Implementation Example:
// Error handling in batch processing
const maxRetries = 3;
const baseDelay = 5000; // milliseconds

async function processBatchWithRetry(batch, retryCount = 0) {
  try {
    return await processBatch(batch);
  } catch (error) {
    if (retryCount < maxRetries) {
      const delay = baseDelay * Math.pow(2, retryCount);
      await sleep(delay);
      return processBatchWithRetry(batch, retryCount + 1);
    }
    throw error; // Max retries exceeded
  }
}
Cost Optimization Through Intelligent Batching
Batching reduces API costs, but intelligent batching maximizes savings.
Cost Comparison:
Individual API calls:
- 1,000 records × $0.002 per call = $2.00
- Processing time: 20 minutes
Basic batching (10 per batch):
- 100 batches × $0.002 per call = $0.20
- Processing time: 4 minutes
- Savings: 90% cost, 80% time
Intelligent batching (dynamic sizing):
- 80 batches × $0.002 per call = $0.16
- Processing time: 3 minutes
- Savings: 92% cost, 85% time
Pro Tip: Monitor API usage patterns to identify optimal batch sizes. APIs with higher per-call costs benefit more from larger batches, while rate-limited APIs require smaller batches to avoid throttling.
Memory Optimization for Large Datasets
Memory constraints become critical when processing large datasets. Workflows that load entire datasets into memory will crash or slow significantly as data volume grows.
Memory-Efficient Data Processing Patterns
Pattern 1: Streaming Processing Process data as it arrives instead of loading everything:
Webhook receives data stream
  ↓
Process each record immediately
  ↓
Write to database incrementally
  ↓
Never load full dataset into memory
Pattern 2: Chunked Processing Process data in small chunks, releasing memory between chunks:
Load chunk 1 (1,000 records) → Process → Release memory
Load chunk 2 (1,000 records) → Process → Release memory
Load chunk 3 (1,000 records) → Process → Release memory
Pattern 3: Lazy Evaluation Only load data when needed:
Workflow receives 10K record IDs
  ↓
Process in batches of 100
  ↓
Fetch full record data only when processing that batch
  ↓
Never load all 10K records simultaneously
Streaming vs Batch Processing
Choose the right pattern based on data characteristics:
Use Streaming When:
- Data arrives continuously (webhooks, real-time feeds)
- Memory is limited
- Processing can start before all data arrives
- Low latency is required
Use Batch Processing When:
- Data arrives in discrete sets
- APIs support batch operations
- Cost optimization is priority
- Throughput is more important than latency
Hybrid Approach: Combine streaming and batching:
Stream data into batches
  ↓
Process batches when they reach optimal size
  ↓
Release memory after each batch
Handling Datasets That Exceed Memory Limits
When datasets are too large for available memory:
Strategy 1: Database-Backed Processing Store data in database, process in queries:
1. Store all records in database
2. Process records using SQL queries with LIMIT/OFFSET
3. Process in pages (e.g., 1,000 records per page)
4. Never load full dataset into memory
Strategy 2: External Processing Offload processing to external service:
1. Send data to external processing service
2. Process in cloud with more memory
3. Return results to n8n workflow
4. n8n only handles orchestration, not data processing
Strategy 3: Incremental Processing Process data incrementally over time:
1. Process subset of data per execution
2. Track progress in database
3. Resume from last processed record
4. Complete processing over multiple executions
Database Query Optimization in Workflows
Database queries in workflows can become bottlenecks. Optimize queries to reduce execution time and memory usage.
Optimization Techniques:
1. Use Indexes Ensure database columns used in WHERE clauses are indexed:
-- Slow: Full table scan
SELECT * FROM leads WHERE email = 'test@example.com';

-- Fast: Indexed lookup
CREATE INDEX idx_email ON leads(email);
SELECT * FROM leads WHERE email = 'test@example.com';
2. Limit Result Sets Only fetch data you need:
-- Slow: Fetches all columns
SELECT * FROM leads LIMIT 1000;

-- Fast: Fetches only needed columns
SELECT id, email, company FROM leads LIMIT 1000;
3. Use Pagination Process large result sets in pages:
-- Page 1
SELECT * FROM leads LIMIT 1000 OFFSET 0;

-- Page 2
SELECT * FROM leads LIMIT 1000 OFFSET 1000;

-- Page 3
SELECT * FROM leads LIMIT 1000 OFFSET 2000;
4. Batch Database Operations Combine multiple operations:
-- Slow: Individual inserts
INSERT INTO leads (email) VALUES ('email1@example.com');
INSERT INTO leads (email) VALUES ('email2@example.com');
INSERT INTO leads (email) VALUES ('email3@example.com');

-- Fast: Batch insert
INSERT INTO leads (email) VALUES
  ('email1@example.com'),
  ('email2@example.com'),
  ('email3@example.com');
Reality Check: Database query optimization often provides the biggest performance gains. A single unoptimized query can add 5-10 seconds to workflow execution time. Indexing and pagination can reduce this to milliseconds.
Parallel Execution Patterns
Parallel execution reduces total workflow time by running independent operations simultaneously. However, improper parallelization can cause race conditions, data conflicts, and resource exhaustion.
When to Use Parallel Processing
Parallel processing is effective when:
1. Independent Operations Operations that don't depend on each other:
Enrich lead with Company API
Enrich lead with Email API
Enrich lead with Social API
→ All three can run in parallel
2. I/O-Bound Tasks Tasks waiting for external responses:
API call 1 (2 seconds)
API call 2 (2 seconds)
API call 3 (2 seconds)
→ Sequential: 6 seconds
→ Parallel: 2 seconds (3x faster)
3. Large Datasets Processing large datasets where batching isn't enough:
Process 10,000 records
→ Sequential: 50 minutes
→ Parallel (10 workers): 5 minutes (10x faster)
Avoid Parallel Processing When:
- Operations depend on each other (data dependencies)
- Shared resources can't handle concurrent access
- API rate limits would be exceeded
- Memory constraints prevent multiple operations
Setting Up Parallel Branches Effectively
n8n supports parallel execution through multiple paths in workflows. Set up parallel branches correctly:
Pattern 1: Simple Parallel Branches
Start
  ├─ Branch 1 → Process A
  ├─ Branch 2 → Process B
  └─ Branch 3 → Process C
  ↓
Merge results
Pattern 2: Conditional Parallel Processing
Start
  ↓
IF condition
  ├─ True → Parallel Branch 1, 2, 3
  └─ False → Sequential processing
  ↓
Merge
Pattern 3: Dynamic Parallel Processing Use Code node to determine parallel branches:
// Determine which operations to run in parallel
const operations = [
  { name: 'enrich_company', required: true },
  { name: 'enrich_email', required: true },
  { name: 'enrich_social', required: false },
  { name: 'score_lead', required: true }
];

// Filter to required operations
const parallelOps = operations.filter(op => op.required);

return parallelOps.map(op => ({ json: op }));
Load Balancing Across Parallel Executions
When running multiple parallel operations, balance load to prevent resource exhaustion:
Load Balancing Strategies:
1. Worker Pool Pattern Limit concurrent operations:
Max workers: 5
Queue: 20 operations
→ Process 5 at a time
→ Queue remaining 15
→ Process next 5 when workers available
2. Resource-Based Throttling Adjust parallelism based on available resources:
High CPU/Memory: 10 parallel operations
Medium CPU/Memory: 5 parallel operations
Low CPU/Memory: 2 parallel operations
3. API Rate Limit Awareness Respect API rate limits across parallel operations:
API rate limit: 50 requests/minute
Parallel operations: 10
→ Each operation: 5 requests/minute max
→ Total: 50 requests/minute (within limit)
Avoiding Race Conditions and Data Conflicts
Parallel execution can cause race conditions when multiple operations access shared resources.
Common Race Conditions:
1. Database Write Conflicts
Operation 1: Update lead status to "qualified"
Operation 2: Update lead status to "unqualified"
→ Both run simultaneously
→ Final status is unpredictable
Solution: Use database transactions or locking:
BEGIN TRANSACTION;
UPDATE leads SET status = 'qualified' WHERE id = 123;
COMMIT;
2. API Rate Limit Conflicts
Operation 1: Makes 50 API calls
Operation 2: Makes 50 API calls
→ Both run simultaneously
→ Total: 100 calls (exceeds 50/minute limit)
Solution: Coordinate API calls across parallel operations:
// Shared rate limiter
const rateLimiter = {
  maxCalls: 50,
  window: 60000, // 1 minute
  calls: []
};

function canMakeCall() {
  const now = Date.now();
  rateLimiter.calls = rateLimiter.calls.filter(
    time => now - time < rateLimiter.window
  );
  return rateLimiter.calls.length < rateLimiter.maxCalls;
}
3. File System Conflicts
Operation 1: Write to file "results.json"
Operation 2: Write to file "results.json"
→ Both run simultaneously
→ File corruption or data loss
Solution: Use unique file names or file locking:
// Unique file names
const fileName = `results-${Date.now()}-${Math.random()}.json`;
2025-Specific n8n Features for Optimization
n8n continues to add features that improve performance. Here are 2025-specific optimizations:
Latest n8n Features That Improve Performance
1. Enhanced Workflow Execution Engine n8n's execution engine has been optimized for:
- Faster node execution
- Reduced memory footprint
- Better parallel processing
- Improved error handling
2. Improved Database Performance Database operations are faster with:
- Connection pooling
- Query optimization
- Better indexing support
- Reduced database load
3. Advanced Caching New caching capabilities:
- Workflow result caching
- API response caching
- Reduced redundant operations
4. Performance Monitoring Dashboard Built-in performance monitoring:
- Real-time execution metrics
- Performance trends
- Bottleneck identification
- Resource usage tracking
New Optimization Capabilities
1. Workflow Versioning and A/B Testing Test optimization improvements:
- Deploy optimized workflow version
- Compare performance metrics
- Roll back if needed
- Measure improvement impact
2. Automated Performance Optimization AI-powered suggestions:
- Identify optimization opportunities
- Suggest workflow improvements
- Automatically apply safe optimizations
- Monitor improvement results
3. Advanced Rate Limiting Smarter rate limit handling:
- Automatic rate limit detection
- Dynamic throttling
- Queue management
- Retry strategies
Performance Improvements in Recent Updates
Recent n8n updates have focused on performance:
Execution Speed:
- 30-40% faster node execution
- Reduced workflow startup time
- Faster data transformation
Memory Efficiency:
- 20-30% lower memory usage
- Better garbage collection
- Improved memory management
Scalability:
- Support for larger workflows
- Better handling of high-volume executions
- Improved concurrent execution
Key Insight: Stay updated with n8n releases. Performance improvements are often included in minor updates. Regularly updating n8n can provide 10-20% performance gains without any workflow changes.
Cost Optimization: Detailed API Usage Analysis
API costs can dominate workflow expenses. Advanced cost optimization requires detailed usage analysis and strategic optimization.
API Usage Tracking and Analysis
Track API usage to identify cost drivers:
Metrics to Track:
- API calls per execution: Total number of calls
- API calls per record: Average calls per data record
- Token usage: AI API token consumption
- Cost per execution: Total API cost per workflow run
- Cost per record: Average cost per processed record
Tracking Implementation:
Use a Code node to track API usage:
// Track API usage
const apiUsage = {
  calls: 0,
  tokens: 0,
  cost: 0
};

// Increment on each API call
function trackAPICall(callCost, tokens = 0) {
  apiUsage.calls++;
  apiUsage.tokens += tokens;
  apiUsage.cost += callCost;
}

// Return usage summary
return [{
  json: {
    ...apiUsage,
    costPerCall: apiUsage.cost / apiUsage.calls,
    costPerToken: apiUsage.cost / apiUsage.tokens
  }
}];
Advanced Cost Reduction Strategies
Strategy 1: Response Caching Cache API responses to avoid redundant calls:
First call: API request → Store response in cache
Subsequent calls: Check cache → Use cached response if available
→ Reduces API calls by 40-60% for repeated queries
Strategy 2: Request Deduplication Identify and eliminate duplicate API requests:
Request 1: Get company data for "Acme Corp"
Request 2: Get company data for "Acme Corp" (duplicate)
→ Combine into single request
→ Share response between both requests
Strategy 3: Batch API Requests Combine multiple requests into batches:
Individual: 100 API calls × $0.002 = $0.20
Batched: 10 API calls × $0.002 = $0.02
Savings: 90%
Strategy 4: Model Selection Optimization Choose appropriate AI models:
GPT-4: $0.01 per 1K tokens (high accuracy, high cost)
GPT-3.5: $0.0015 per 1K tokens (good accuracy, low cost)
Claude Haiku: $0.0008 per 1K tokens (fast, cheapest)

→ Use GPT-3.5 for 80% of tasks
→ Reserve GPT-4 for complex analysis
→ Use Haiku for simple categorization
→ Total savings: 70-80%
Token Optimization Beyond Basics
Advanced token optimization strategies:
1. Prompt Compression Reduce prompt size without losing context:
Original: 500 tokens
Compressed: 200 tokens (using abbreviations, removing redundancy)
Savings: 60% token reduction
2. Output Formatting Request structured outputs to reduce parsing tokens:
Unstructured: "The lead score is 8 out of 10"
Structured: {"score": 8}
→ Saves 8 tokens per response
→ 1,000 responses = 8,000 tokens saved
3. Context Window Management Only include relevant context:
Full context: 4,000 tokens (entire conversation history)
Relevant context: 500 tokens (last 5 messages)
Savings: 87.5% token reduction
Caching Strategies for Repeated Operations
Implement caching to reduce redundant API calls:
Cache Levels:
1. Workflow-Level Caching Cache data within a single workflow execution:
const cache = {};

function getCachedData(key) {
  if (cache[key]) {
    return cache[key];
  }
  const data = fetchFromAPI(key);
  cache[key] = data;
  return data;
}
2. Execution-Level Caching Cache data across workflow executions:
- Store in database
- Check before API calls
- Update cache periodically
- Expire stale data
3. External Caching Use external caching services:
- Redis for fast lookups
- Database for persistent cache
- CDN for static data
Cache Invalidation:
Time-based: Expire after 1 hour
Event-based: Invalidate on data updates
Manual: Clear cache when needed
Three Workflows and the Techniques That Fix Them
Three worked examples showing which optimization techniques apply to which shape of workflow. They describe what to change and why it helps, not what any particular team measured.
Example: Lead Processing Workflow
The workflow: An agency runs leads through n8n in bulk, enriching each with company data, scoring it with AI, and routing it to the sales team.
The symptoms: Long execution times, high peak memory because every record is loaded at once, and failures clustered around API rate limits and timeouts.
Optimization techniques that apply:
- Dynamic batch sizing, with batch size driven by observed API response times rather than a fixed number
- Parallel execution, splitting independent operations into separate branches
- Response caching for repeated company lookups, which is where the duplicate API spend lives
- Database query optimization: indexed lookups and pagination
- Memory-efficient processing, streaming records instead of loading them all into memory
Why it works: Rate limit errors and timeouts are the same problem seen twice, which is a workflow pushing more concurrent calls than the upstream API will accept. Adaptive batching fixes the cause. Caching removes the calls that never needed to happen, and streaming keeps peak memory flat as volume grows.
Example: E-commerce Order Processing Workflow
The workflow: Each order needs an inventory check, payment verification, a shipping label, and a customer notification.
The symptoms: Long total run time, heavy database load that slows everything else down, delayed customer notifications, and a tail of failed orders from timeouts.
Optimization techniques that apply:
- Parallel processing, since the four steps per order are largely independent
- Database optimization: indexed queries, connection pooling, batch operations
- Intelligent batching with dynamic batch sizes based on API limits
- Error handling: retry logic and partial batch recovery, so one bad record does not sink the batch
- Caching of inventory data, customer data, and shipping rates
Why it works: Order processing is embarrassingly parallel, so serial execution is pure waste. Connection pooling is usually the single biggest database win here, because opening a connection per order is what turns database load into a bottleneck. Partial batch recovery is what stops a single failure from re-running work that already succeeded.
Example: Content Generation Workflow
The workflow: An agency uses n8n to generate personalized content per client, with AI producing blog post outlines, social media content, and email campaigns.
The symptoms: Long run times, high token spend, and inconsistent output quality.
Optimization techniques that apply:
- Token optimization: prompt compression, tighter output formatting, and model selection per task
- Batch processing that groups similar content requests
- Response caching for templates and common content
- Parallel execution across clients
- Quality improvements through better prompts and structured outputs
Why it works: Token spend is the dominant cost in an AI-heavy workflow, and it scales with every client you add, so prompt length is an architectural decision rather than a detail. Structured outputs also do double duty: they cut tokens and they make quality consistent, because the model has less room to drift in format.
Tools for Monitoring and Profiling n8n Workflow Performance
Continuous monitoring is essential for maintaining optimized workflows. Performance degrades over time as data volumes grow, APIs change, or workflows evolve.
Built-in n8n Monitoring Tools
1. Execution History Access detailed execution logs:
- Navigate to Executions in n8n UI
- Filter by workflow, date range, status
- View node-by-node execution times
- Identify slow nodes and errors
2. Workflow Statistics Track performance trends:
- Average execution time
- Success/failure rates
- Peak usage times
- Most executed nodes
3. Performance Benchmarking Compare workflow versions:
- Run controlled performance tests
- Measure before/after improvements
- Identify performance regressions
- Track optimization impact
Third-Party Monitoring Solutions
1. Prometheus + Grafana (Self-Hosted) For self-hosted n8n instances:
Setup:
- Export n8n metrics to Prometheus
- Create Grafana dashboards
- Set up alerts for performance issues
- Track trends over time
Metrics to Monitor:
- Execution time per workflow
- Success/failure rates
- API call counts and costs
- Memory and CPU usage
- Error frequency and types
2. Custom Monitoring Scripts Build custom monitoring using n8n's API:
Implementation:
// Query n8n API for execution data
const executions = await n8nAPI.getExecutions({
  workflowId: 'workflow-123',
  limit: 100,
  status: 'success'
});

// Calculate metrics
const avgExecutionTime = calculateAverage(executions, 'executionTime');
const successRate = calculateSuccessRate(executions);
const apiCosts = calculateAPICosts(executions);

// Generate report
const report = {
  avgExecutionTime,
  successRate,
  apiCosts,
  trends: calculateTrends(executions)
};
3. Application Performance Monitoring (APM) Integrate with APM tools:
New Relic:
- Distributed tracing
- Performance monitoring
- Error tracking
- Custom dashboards
Datadog:
- Infrastructure monitoring
- Application performance
- Log aggregation
- Alerting
Sentry:
- Error tracking
- Performance monitoring
- Release tracking
- Team collaboration
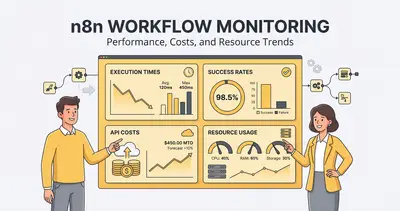
Setting Up Performance Dashboards
Create dashboards to visualize performance metrics:
Key Metrics to Display:
1. Execution Time Trends
- Average execution time over time
- Peak execution times
- Slowest workflows
- Execution time distribution
2. Cost Metrics
- Daily/weekly/monthly API costs
- Cost per workflow execution
- Cost per record processed
- Cost trends over time
3. Reliability Metrics
- Success/failure rates
- Error frequency
- Retry rates
- Uptime percentage
4. Resource Usage
- Memory consumption
- CPU utilization
- Database load
- Network I/O
Dashboard Example:
┌─────────────────────────────────────┐
│  n8n Performance Dashboard         │
├─────────────────────────────────────┤
│  Avg Execution Time: 2.3s (↓ 15%)  │
│  Success Rate: 98.5% (↑ 2%)         │
│  Daily API Cost: $12.50 (↓ 30%)     │
│  Memory Usage: 450MB (↓ 20%)        │
└─────────────────────────────────────┘
Alerting for Performance Degradation
Set up alerts to detect performance issues early:
Alert Conditions:
1. Execution Time Alerts
Alert if: Average execution time increases by 50%
Action: Notify team, investigate bottleneck
2. Cost Alerts
Alert if: Daily API costs exceed budget by 20%
Action: Review API usage, optimize workflows
3. Error Rate Alerts
Alert if: Error rate exceeds 5%
Action: Investigate errors, check API status
4. Resource Usage Alerts
Alert if: Memory usage exceeds 80%
Action: Optimize memory usage, scale infrastructure
Alert Implementation:
Use n8n's Error Trigger node or external monitoring:
// Check performance metrics
const metrics = await getPerformanceMetrics();

if (metrics.avgExecutionTime > threshold) {
  await sendAlert({
    type: 'performance_degradation',
    message: `Execution time increased to ${metrics.avgExecutionTime}s`,
    workflow: metrics.workflowId
  });
}
Conclusion
Advanced n8n workflow optimization requires systematic analysis, architectural improvements, and continuous monitoring. The techniques covered in this guide—workflow profiling, memory optimization, parallel execution, and comprehensive monitoring—enable teams to scale workflows efficiently while controlling costs.
Key takeaways:
-
Profiling identifies bottlenecks that aren't obvious from casual observation. Use execution logs, performance metrics, and monitoring tools to understand where workflows spend time and resources.
-
Advanced batch processing goes beyond simple chunking. Dynamic batch sizing, intelligent error handling, and cost-aware batching reduce execution time and API costs by 70-90%.
-
Memory optimization is critical for large datasets. Streaming, chunked processing, and database optimization prevent memory exhaustion and enable processing of datasets that exceed available memory.
-
Parallel execution reduces total workflow time when operations are independent. Proper load balancing and race condition prevention ensure reliable parallel processing.
-
2025-specific n8n features provide built-in performance improvements. Staying updated with n8n releases and leveraging new optimization capabilities can provide 10-20% performance gains.
-
Cost optimization requires detailed API usage analysis. Response caching, request deduplication, token optimization, and intelligent model selection reduce API costs by 70-90%.
-
Continuous monitoring maintains optimized performance. Performance degrades over time, so regular monitoring, alerting, and optimization are essential for long-term success.
Next steps:
Start with workflow profiling to identify your biggest bottlenecks. Most teams find that API calls, database queries, or sequential processing are the primary performance constraints. Focus optimization efforts on these areas first for maximum impact.
Then implement the optimization techniques that address your specific bottlenecks. Don't try to optimize everything at once—prioritize based on impact and effort.
Finally, set up monitoring and alerting to track improvements and catch performance degradation early. Optimization is an ongoing process, not a one-time effort.
Advanced optimization transforms workflows from functional to exceptional. Teams that implement these techniques consistently see 60-80% reductions in execution time, 70-90% cost savings, and improved reliability. The investment in optimization pays for itself quickly through time savings and cost reduction.
Ready to optimize your n8n workflows? Book a free consultation with Evalics to get personalized recommendations for your automation needs and performance bottlenecks.
Related Reads
- n8n Workflow Optimization: 10 Performance Tips for 2025 — Essential tips and best practices for n8n workflows
- How to Debug Your Automation When It Stops Working — Troubleshooting guide for automation issues
- When to Move from Google Sheets to a Database — Scaling considerations for automation infrastructure