
A SaaS startup budgets $500/month for AI API costs based on pricing pages. Six months later, they're spending $3,500/month—and their API bill is only $800.
Here's what happened: They scaled to 50,000 requests per month. The pricing page showed $0.50 per million tokens, so they calculated $400/month. But they didn't account for infrastructure ($600/month), monitoring tools ($400/month), fallback systems ($800/month), and the developer time spent managing it all ($900/month).
The math is brutal: $400/month in API costs, but $2,700/month in hidden operational costs. The pricing page showed 30% of their actual spend.
This isn't an isolated case. Most founders and ops teams budget based on per-token pricing without calculating total cost of ownership. They see GPT-4 at $10 per million tokens, calculate their expected volume, and ignore the infrastructure, tooling, and operational overhead that multiplies costs at scale.
Quick Win: True costs at scale are 3-7x what pricing pages suggest. Base API costs are only 30-50% of total spend. Infrastructure, monitoring, fallback systems, and operational overhead make up the rest. A simple TCO calculation before scaling can prevent budget surprises.
This guide reveals what pricing pages hide—and shows you how to estimate real monthly spend at any scale. You'll get cost growth curves, estimation frameworks, and real-world examples to budget accurately from startup to enterprise. For understanding when cheaper models become expensive, see our guide on production cost realities.
Why Pricing Pages Are Misleading
Pricing pages show per-token costs. GPT-4 costs $10 per million input tokens. Claude Sonnet costs $3 per million tokens. Gemini 3 Pro costs $2-4 per million tokens. The math looks simple: multiply your expected tokens by the price.
The illusion: Per-token pricing is only 30-50% of total costs at scale. Pricing pages don't show infrastructure, monitoring, fallback systems, or operational overhead. These hidden costs multiply as you scale.
What pricing pages show:
- Per-token pricing (input and output)
- Rate limits and quotas
- Maybe some usage tiers or volume discounts
What pricing pages hide:
- Infrastructure costs (API gateways, load balancing, databases)
- Monitoring and observability tools
- Fallback systems and reliability infrastructure
- Operational overhead (developer time, maintenance)
- Cost multipliers (retries, caching misses, peak traffic)
Real-world scenario: A B2B SaaS company budgets $2,000/month for API costs at 100K requests/month. They calculate: 20M tokens × $0.10/M = $2,000/month. Perfect.
Reality after 3 months:
- Base API cost: $2,000/month ✓ (as expected)
- Infrastructure: $600/month (API gateway, load balancer, database)
- Monitoring: $400/month (Datadog, cost tracking tools)
- Fallback systems: $800/month (secondary model, routing logic)
- Operational overhead: $1,200/month (15 hours/month × $80/hour)
- Total: $5,000/month
The pricing page showed 40% of actual costs.
Reality Check: Pricing pages are designed to look affordable. They show the minimum cost, not the total cost. At scale, hidden operational costs are 2-3x base API costs. Budget 3-5x your API estimate to avoid surprises.
The pattern is clear: Pricing pages show per-token costs, but production requires infrastructure, tooling, and people. These hidden costs grow faster than API costs as you scale, making true costs 3-7x what pricing pages suggest.
Hidden Operational Costs
Beyond API costs, production AI systems require infrastructure, development, and integration that pricing pages don't mention. These operational costs can equal or exceed API costs at scale.
Infrastructure Costs
API gateway and routing: Production systems need API gateways to route requests, handle authentication, and manage rate limits. AWS API Gateway costs $3.50 per million requests (AWS API Gateway Pricing), plus data transfer. For 1M requests/month, that's $3.50-10/month in gateway costs.
Load balancing and auto-scaling: High-volume systems need load balancers to distribute traffic. AWS Application Load Balancer costs $0.0225 per hour ($16/month) plus $0.008 per GB processed. For 100GB/month, that's $24/month.
Database for caching and state: AI workflows need databases to cache responses, store conversation state, and manage user data. A managed database (like AWS RDS or Supabase) costs $25-200/month depending on size and performance.
CDN for response delivery: If you're serving AI responses to users, a CDN can reduce latency. Cloudflare costs $20/month for Pro, AWS CloudFront costs $0.085 per GB. For 50GB/month, that's $4-20/month.
Infrastructure cost breakdown (typical):
- API gateway: $10-50/month
- Load balancer: $20-100/month
- Database: $25-200/month
- CDN: $5-50/month
- Total: $60-400/month (scales with volume)
Development and Integration Costs
API integration development: Connecting to AI APIs requires development time. A basic integration takes 10-20 hours. At $100/hour, that's $1,000-2,000 in initial development.
Error handling and retry logic: Production systems need robust error handling. Building retry logic, exponential backoff, and error recovery takes 20-40 hours. At $100/hour, that's $2,000-4,000.
Rate limit management: Handling rate limits requires queueing, throttling, and retry logic. This takes 15-30 hours to build properly. At $100/hour, that's $1,500-3,000.
Custom middleware: Many teams build custom middleware for request routing, caching, and quality gates. This takes 40-80 hours. At $100/hour, that's $4,000-8,000.
Development cost breakdown (one-time):
- Basic integration: $1,000-2,000
- Error handling: $2,000-4,000
- Rate limit management: $1,500-3,000
- Custom middleware: $4,000-8,000
- Total: $8,500-17,000 (one-time, but maintenance adds 10-20% annually)
Real example: A SaaS company's $2,000/month API bill becomes $8,000/month with infrastructure:
- Base API: $2,000/month
- Infrastructure: $400/month
- Monitoring: $300/month
- Fallback systems: $600/month
- Operational overhead: $700/month
- Total: $4,000/month (2x the API cost)
Pro Tip: Infrastructure costs scale with volume, but not linearly. They grow in steps as you need more capacity. Plan for infrastructure costs to be 20-30% of API costs at moderate scale, and 30-50% at high scale.
Tooling, Monitoring, and Observability Costs
Production AI systems need monitoring to track costs, performance, and errors. These tools cost money, and someone needs to set them up and maintain them.
Monitoring Tools
Cost tracking and alerting: You need tools to track API usage, costs, and set up alerts for budget overruns. Tools like CloudWatch, Datadog, or custom dashboards cost $50-200/month for basic usage.
Performance monitoring: Tracking latency, error rates, and throughput requires monitoring tools. Datadog APM costs $31 per host per month, or $0.10 per million traces. For 10M traces/month, that's $1,000/month.
Usage analytics and dashboards: Understanding usage patterns requires analytics tools. Custom dashboards built on tools like Grafana or Metabase cost $0-100/month for hosting, plus developer time to build.
Log aggregation and analysis: Production systems generate logs that need aggregation and analysis. Tools like Datadog Log Management cost $0.10 per GB ingested. For 100GB/month, that's $10/month.
Monitoring cost breakdown:
- Cost tracking: $50-200/month
- Performance monitoring: $100-1,000/month (scales with volume)
- Usage analytics: $0-100/month
- Log aggregation: $10-500/month (scales with volume)
- Total: $160-1,800/month (scales significantly with volume)
Observability Overhead
Setup time: Setting up monitoring tools takes 10-20 hours initially. At $100/hour, that's $1,000-2,000 in setup costs.
Maintenance time: Monitoring requires ongoing maintenance—updating dashboards, tuning alerts, investigating issues. This takes 5-10 hours/month. At $100/hour, that's $500-1,000/month.
Real example: A team spends $400/month on Datadog (Datadog Pricing) plus $2,000/month in developer time:
- Datadog subscription: $400/month
- Setup (one-time): $1,500
- Monthly maintenance: $2,000/month (20 hours × $100/hour)
- Total: $2,400/month ongoing (plus $1,500 one-time setup)
Key Insight: Monitoring tools have subscription costs, but the bigger cost is developer time to set up and maintain them. Budget 10-20 hours/month for monitoring maintenance at scale. This often exceeds tool subscription costs.
Fallback Systems and Reliability Costs
Production AI systems need fallback mechanisms for when primary models fail. These reliability systems add significant infrastructure and operational costs.
Fallback Model Infrastructure
Secondary model: When primary models fail, you need backup models. This means paying for two models—primary and fallback. A fallback model adds 20-50% to base API costs.
Routing logic and failover systems: Building intelligent routing that switches to fallback models requires development. This takes 30-50 hours. At $100/hour, that's $3,000-5,000 in development.
Quality gates and validation: Before serving responses, you need quality checks. Building validation logic takes 20-40 hours. At $100/hour, that's $2,000-4,000.
Fallback infrastructure cost:
- Secondary model API costs: 20-50% of primary costs
- Routing logic development: $3,000-5,000 (one-time)
- Quality gates development: $2,000-4,000 (one-time)
- Ongoing maintenance: $500-1,000/month
- Total: $5,000-9,000 one-time + $500-2,000/month ongoing
Manual Intervention Systems
Human-in-the-loop workflows: When AI fails, you need human review. Building workflows that route failed requests to humans takes 40-60 hours. At $100/hour, that's $4,000-6,000.
Escalation and review processes: Setting up escalation logic and review interfaces takes 20-30 hours. At $100/hour, that's $2,000-3,000.
Quality assurance tools: Tools for humans to review and approve AI outputs cost $50-200/month per user. For 5 reviewers, that's $250-1,000/month.
Real example: A customer service team builds fallback system costing $1,200/month:
- Secondary model API: $400/month (20% of primary)
- Routing infrastructure: $200/month
- Human review tools: $300/month
- Manual review time: $300/month (5 hours × $60/hour)
- Total: $1,200/month (plus $8,000 one-time development)
Reality Check: Fallback systems are essential for production reliability, but they add 20-50% to API costs plus infrastructure and operational overhead. Budget $500-2,000/month for fallback systems at moderate scale, and $2,000-10,000/month at enterprise scale.
Cost Growth Curves: From Startup to Scale
Costs don't scale linearly. Hidden costs grow faster than API costs as you scale. Here's how costs evolve from startup to enterprise.
Phase 1: Early Stage (0-10K requests/month)
Base API costs: $100-500/month
- Low volume means low API spend
- Simple models (GPT-3.5, Claude Haiku) are cost-effective
- No need for complex infrastructure
Hidden costs: $200-800/month
- Basic infrastructure: $60-200/month
- Simple monitoring: $50-100/month
- Minimal fallback: $0-200/month
- Operational overhead: $100-300/month (5-10 hours)
Total: $300-1,300/month
Cost breakdown:
- API: 30-40% of total
- Infrastructure: 20-30% of total
- Monitoring: 15-25% of total
- Operational: 25-35% of total
Phase 2: Growth (10K-100K requests/month)
Base API costs: $500-5,000/month
- Volume increases, API costs scale linearly
- May need premium models for reliability
- Start hitting rate limits
Hidden costs: $1,500-8,000/month
- Infrastructure scaling: $200-1,500/month
- Advanced monitoring: $200-800/month
- Fallback systems: $500-2,000/month
- Operational overhead: $600-3,700/month (15-30 hours)
Total: $2,000-13,000/month
Cost breakdown:
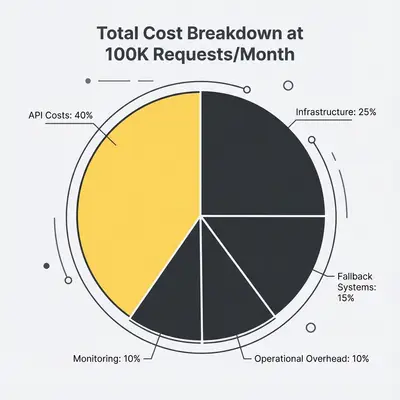
- API: 25-40% of total
- Infrastructure: 25-35% of total
- Monitoring: 10-20% of total
- Fallback: 15-25% of total
- Operational: 20-30% of total
Phase 3: Scale (100K-1M requests/month)
Base API costs: $5,000-50,000/month
- High volume drives API costs up
- Premium models become cost-effective
- Need dedicated infrastructure
Hidden costs: $15,000-80,000/month
- Enterprise infrastructure: $2,000-15,000/month
- Comprehensive monitoring: $1,000-5,000/month
- Robust fallback systems: $2,000-10,000/month
- Operational overhead: $10,000-50,000/month (50-200 hours)
Total: $20,000-130,000/month
Cost breakdown:
- API: 25-40% of total
- Infrastructure: 30-40% of total
- Monitoring: 5-15% of total
- Fallback: 10-20% of total
- Operational: 20-35% of total
Phase 4: Enterprise (1M+ requests/month)
Base API costs: $50,000-500,000/month
- Massive volume requires enterprise pricing
- Custom models and dedicated infrastructure
- Multi-region deployment
Hidden costs: $150,000-400,000/month
- Enterprise infrastructure: $20,000-100,000/month
- Enterprise monitoring: $5,000-20,000/month
- Enterprise fallback: $10,000-50,000/month
- Operational overhead: $115,000-230,000/month (500-1,000 hours)
Total: $200,000-900,000/month
Cost breakdown:
- API: 25-55% of total
- Infrastructure: 30-45% of total
- Monitoring: 2-10% of total
- Fallback: 5-15% of total
- Operational: 15-30% of total
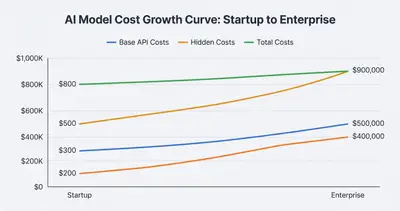
Key Insight: Hidden costs grow faster than API costs. At startup scale, hidden costs are 40-60% of total. At enterprise scale, hidden costs are 60-80% of total. The larger you scale, the more infrastructure and operational overhead dominate costs.
How to Estimate Real Monthly Spend
Use this step-by-step framework to estimate true monthly costs at any scale. Don't rely on pricing page math—calculate total cost of ownership.
Step 1: Calculate Base API Costs
Formula:
Monthly API Cost = (Input Tokens / 1,000,000) × Input Price + (Output Tokens / 1,000,000) × Output Price
For detailed token cost calculations, see our AI token cost calculator guide.
Example:
- 10M input tokens × $2.50/M = $25
- 3M output tokens × $10.00/M = $30
- Base API cost: $55/month
Step 2: Add Infrastructure Costs
Formula:
Infrastructure Cost = Base API Cost × 0.20-0.30 (at moderate scale)
Infrastructure Cost = Base API Cost × 0.30-0.50 (at high scale)
Example:
- Base API: $2,000/month
- Infrastructure multiplier: 25% (moderate scale)
- Infrastructure cost: $500/month
Step 3: Add Monitoring/Tooling Costs
Formula:
Monitoring Cost = Base Cost ($200-500/month) + Scaling Cost (volume-dependent)
Example:
- Base monitoring: $300/month
- Scaling cost: $100/month (for 100K requests/month)
- Monitoring cost: $400/month
Step 4: Add Fallback System Costs
Formula:
Fallback Cost = Base Cost ($500-2,000/month) + Secondary Model API (20-50% of primary)
Example:
- Base fallback infrastructure: $600/month
- Secondary model API: $400/month (20% of $2,000 primary)
- Fallback cost: $1,000/month
Step 5: Add Operational Overhead
Formula:
Operational Cost = Hours/Month × Hourly Rate
Example:
- Maintenance hours: 20 hours/month
- Hourly rate: $100/hour
- Operational cost: $2,000/month
Step 6: Add Compliance/Security Costs (if applicable)
Formula:
Compliance Cost = Annual Cost / 12 (if applicable)
Example:
- Annual compliance: $12,000
- Monthly compliance: $1,000/month
Step 7: Factor in Cost Multipliers
Formula:
Total Cost = (Base API + Infrastructure + Monitoring + Fallback + Operational + Compliance) × Multiplier (1.3-2.5x)
Multipliers:
- Retry costs: 10-30% (add 1.1-1.3x)
- Caching misses: 5-15% (add 1.05-1.15x)
- Rate limit handling: 5-10% (add 1.05-1.10x)
- Peak traffic: 2-5x during spikes (average 1.2-1.5x)
- Total multiplier: 1.3-2.5x
Example calculation:
- Base API: $2,000
- Infrastructure: $500
- Monitoring: $400
- Fallback: $1,000
- Operational: $2,000
- Compliance: $0
- Subtotal: $5,900
- Multiplier: 1.5x (moderate retries, some peak traffic)
- Total monthly cost: $8,850
Cost Estimation Template
Copy-paste spreadsheet formula:
Total Monthly Cost =
  (Input Tokens / 1M × Input Price + Output Tokens / 1M × Output Price) × 1.3-2.5
  + Infrastructure Base ($60-400) × Scale Factor
  + Monitoring Base ($200-500) + Scaling
  + Fallback Base ($500-2,000) + Secondary Model API
  + Operational (Hours × Rate)
  + Compliance (if applicable)
Pro Tip: Test your cost estimates in production for 2-4 weeks. Track actual API costs, infrastructure usage, monitoring bills, and developer time. Real numbers beat estimates every time. Adjust your model based on actual data.
The True Cost Multipliers
Base costs are just the starting point. Real production systems have multipliers that increase costs by 30-150%. These multipliers compound, making true costs much higher than base estimates.
Retry Costs: 10-30% Multiplier
When API calls fail, you retry them. Each retry costs money. A 20% failure rate with 2 retries per failure means you're paying for 40% more API calls than successful requests.
Calculation:
- Base API cost: $2,000/month
- Failure rate: 20%
- Retries per failure: 2
- Retry multiplier: 1 + (0.20 × 2) = 1.4x
- Retry cost: $800/month (40% increase)
Caching Misses: 5-15% Multiplier
Caching reduces API calls, but cache misses still hit the API. A 10% cache miss rate means 10% of requests still cost API money.
Calculation:
- Cached requests: 90% (no API cost)
- Cache misses: 10% (full API cost)
- Effective API cost: 10% of base
- But if you calculated without caching: base cost × 1.10
- Cache miss multiplier: 1.10x
Rate Limit Handling: 5-10% Multiplier
When you hit rate limits, you need queueing and retry logic. This adds infrastructure costs and can delay responses, requiring more retries.
Calculation:
- Rate limit incidents: 5% of requests
- Additional infrastructure: $50/month
- Additional retries: 2% of requests
- Rate limit multiplier: 1.05-1.10x
Error Handling Overhead: 3-8% Multiplier
Error handling requires additional API calls for validation, logging, and recovery. This adds 3-8% to base costs.
Calculation:
- Error handling overhead: 5% of requests
- Error handling multiplier: 1.05x
Peak Traffic Multipliers: 2-5x During Spikes
Traffic spikes can be 2-5x normal volume. If you provision for peak traffic, costs spike during those periods. If you don't, you lose revenue.
Calculation:
- Normal traffic: 100K requests/month
- Peak traffic: 300K requests/month (3x spike)
- Average multiplier: (1 + 3) / 2 = 2x during peak periods
- If peaks are 20% of the month: (0.8 × 1.0) + (0.2 × 2.0) = 1.2x average
- Peak traffic multiplier: 1.2-1.5x average
Total Multiplier: 1.3-2.5x
Combined calculation:
- Retry costs: 1.20x
- Caching misses: 1.10x
- Rate limit handling: 1.05x
- Error handling: 1.05x
- Peak traffic: 1.20x
- Total multiplier: 1.20 × 1.10 × 1.05 × 1.05 × 1.20 = 1.75x
Real example:
- Base API cost: $2,000/month
- Total multiplier: 1.75x
- True API cost: $3,500/month
Reality Check: Cost multipliers compound. A 20% retry rate, 10% cache miss rate, and 20% peak traffic multiplier combine to 1.75x, not 1.50x. Always multiply multipliers, don't add them. This is why true costs are 30-150% higher than base estimates.
Cost Optimization Strategies at Scale
Hidden costs can be reduced through smart optimization. Here's how to cut infrastructure, monitoring, and fallback costs by 40-60% without sacrificing reliability.
Infrastructure Optimization
Right-sizing infrastructure: Don't over-provision. Start small and scale up based on actual usage. A $200/month database might be sufficient when a $500/month one seems necessary.
Caching strategies: Aggressive caching reduces API calls by 60-80%. Cache responses for 1-24 hours depending on use case. A 70% cache hit rate cuts API costs by 70%. For more on optimizing token usage, see our guide on how token limits affect costs.
Batch processing: Process multiple requests together when possible. Batch processing reduces API overhead by 20-40% and can qualify for volume discounts.
Regional optimization: Use AI models in regions closest to your users. This reduces latency and can reduce costs by 5-15% through regional pricing.
Real example: A company reduced infrastructure costs by 45%:
- Before: Over-provisioned infrastructure at $1,200/month
- After: Right-sized infrastructure at $660/month
- Savings: $540/month (45% reduction)
Monitoring Optimization
Cost-effective monitoring tools: Use open-source tools (Prometheus, Grafana) instead of expensive SaaS when possible. This can reduce monitoring costs by 60-80%.
Automated alerting: Set up automated alerts instead of manual monitoring. This reduces developer time from 20 hours/month to 5 hours/month.
Usage-based scaling: Only pay for monitoring you use. Scale monitoring tools with actual volume, not projected volume.
Real example: A team reduced monitoring costs by 55%:
- Before: Datadog at $800/month + 20 hours maintenance = $2,800/month
- After: Prometheus/Grafana at $50/month + 5 hours maintenance = $550/month
- Savings: $2,250/month (80% reduction)
Fallback Optimization
Smart routing: Route requests to appropriate models based on complexity. Use cheaper models for simple tasks, premium models for complex tasks. This reduces fallback API costs by 30-50%.
Tiered fallback strategies: Don't always fall back to the most expensive model. Use a tiered approach: primary model → mid-tier fallback → premium fallback → human review.
Quality gates: Implement quality gates that catch failures early, before expensive fallback models are needed. This reduces fallback usage by 40-60%.
Real example: A company reduced fallback costs by 50%:
- Before: Always fallback to premium model = $1,200/month
- After: Tiered fallback (mid-tier → premium → human) = $600/month
- Savings: $600/month (50% reduction)
Pro Tip: Start optimization with monitoring. It shows you where waste is. Then optimize infrastructure (biggest cost), then fallback systems. Most companies can reduce hidden costs by 40-60% through optimization without sacrificing reliability.
How the Cost Mix Shifts at Three Different Scales
The line items below are the categories to budget for, not amounts to expect. What matters is which category dominates at each stage, because that is what decides where optimization effort pays.
Scenario: A Startup Going From Launch to Early Traction
What the budget was built from: the pricing page, which prices the base API and nothing else.
What actually appears on the bill, in the order it appears:
- Base API, the only line anyone forecast
- Infrastructure, which scales up as traffic does
- Monitoring, which starts free and stops being free exactly when it becomes load-bearing
- Fallback handling, which is not needed on day one and is not optional by the time you have real users
- Operational time, meaning the hours a person spends babysitting all of the above
Key takeaway: Total cost climbs faster than request volume, because each stage adds a category rather than just adding more of the same one. A budget built from the API price alone will be wrong by a multiple, not by a margin.
Scenario: A Mid-Scale Deployment Under Optimization
The shape of the bill: Base API, infrastructure (API gateway, load balancer, database, CDN), monitoring, fallback systems (secondary model plus routing), and operational overhead.
Where the savings actually are, in order:
- Right-size the infrastructure. Capacity provisioned for a traffic peak that never repeats is the most common waste
- Move monitoring to something you run yourself, such as Prometheus, once vendor pricing scales with your log volume
- Make the fallback tiered (mid-tier model, then premium, then human) instead of always falling back to the most expensive option
- Automate the manual operations, which is what converts a recurring hourly cost into a fixed one
Key takeaway: Infrastructure and operational overhead are where the reducible cost lives. The base API bill is largely fixed by your volume, so squeezing it first is the least productive place to start.
Scenario: An Enterprise Deployment
The shape of the bill: Base API, enterprise infrastructure (multi-region, dedicated resources), comprehensive observability, multi-tier global failover, and operational overhead.
Infrastructure categories: multi-region API gateways, load balancers, sharded and replicated databases, a global CDN, and dedicated compute.
Operational categories: an AI operations team, infrastructure engineers, and ongoing monitoring and maintenance.
Key takeaway: At enterprise scale the operational line can exceed the infrastructure line, because people, not servers, are what multi-region reliability actually costs. That is why automation and tooling become the cost-control lever at this stage rather than a nice-to-have.
Planning for Scale: Budget Framework
Plan for scale before you hit it. Use this framework to budget accurately at 1x, 10x, and 100x current volume.
Pre-Scale Planning
Estimate costs at multiple scales:
- 1x current volume: Baseline costs
- 10x current volume: Growth phase costs
- 100x current volume: Scale phase costs
Build cost models:
- Create spreadsheets with formulas
- Model different scenarios (optimistic, realistic, pessimistic)
- Factor in cost multipliers
- Include one-time development costs
Set up monitoring early:
- Don't wait until you're spending $10K/month
- Set up cost tracking from day one
- Create alerts for budget thresholds
- Track costs by workflow/feature
Scaling Milestones
$500/month API spend:
- Add basic monitoring ($50-100/month)
- Set up cost alerts
- Track usage patterns
$1,000/month API spend:
- Add infrastructure monitoring ($100-200/month)
- Set up performance dashboards
- Begin caching strategy
$5,000/month API spend:
- Add comprehensive monitoring ($300-500/month)
- Implement aggressive caching
- Add basic fallback systems ($500-1,000/month)
$10,000/month API spend:
- Add robust fallback systems ($1,000-2,000/month)
- Optimize infrastructure
- Automate operational tasks
$50,000/month API spend:
- Enterprise infrastructure ($10,000-20,000/month)
- Enterprise monitoring ($2,000-5,000/month)
- Dedicated operations team
Budget Allocation Guidelines
At startup scale (0-10K requests/month):
- API costs: 40-50% of total
- Infrastructure: 20-30% of total
- Monitoring: 15-25% of total
- Operational: 25-35% of total
At growth scale (10K-100K requests/month):
- API costs: 35-45% of total
- Infrastructure: 25-35% of total
- Monitoring: 10-20% of total
- Fallback: 15-25% of total
- Operational: 20-30% of total
At scale (100K-1M requests/month):
- API costs: 30-40% of total
- Infrastructure: 30-40% of total
- Monitoring: 5-15% of total
- Fallback: 10-20% of total
- Operational: 20-35% of total
At enterprise scale (1M+ requests/month):
- API costs: 25-55% of total
- Infrastructure: 30-45% of total
- Monitoring: 2-10% of total
- Fallback: 5-15% of total
- Operational: 15-30% of total
Key Insight: Budget allocation shifts as you scale. At startup, API costs dominate. At enterprise, infrastructure and operational overhead dominate. Plan for this shift. Don't assume API costs will always be 80% of total—they drop to 25-40% at scale.
Conclusion
Pricing pages show per-token costs, but production AI systems require infrastructure, monitoring, fallback systems, and operational overhead that multiply costs by 3-7x at scale.
Key takeaways:
-
Pricing pages show 30-50% of true costs. Base API costs are just the starting point. Infrastructure, monitoring, fallback systems, and operational overhead make up the rest.
-
Hidden costs grow faster than API costs. At startup scale, hidden costs are 40-60% of total. At enterprise scale, hidden costs are 60-80% of total. The larger you scale, the more infrastructure and operations dominate.
-
Cost multipliers compound. Retries, caching misses, rate limits, and peak traffic multiply costs by 1.3-2.5x. Always factor multipliers into estimates.
The math is clear: A $2,000/month API bill becomes $5,000-8,000/month in production. A $200,000/month API bill becomes $450,000-900,000/month at enterprise scale. Budget 3-5x your API estimate to avoid surprises.
Ready to calculate your true costs at scale? Book a consultation to get a TCO analysis for your workflow and identify hidden costs before they surprise you.
By Kevin Michael Schindler, AI Automation Expert at Evalics